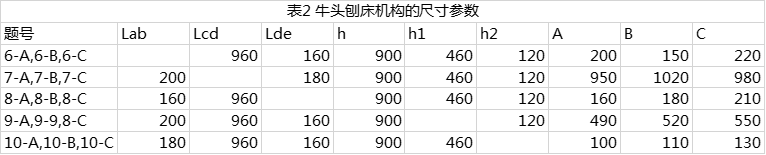
PDF文章下载(严禁将本文章包括但不限于用于作弊、抄袭的用途上,欢迎指出问题!):http://pan.baidu.com/s/1hqxRhju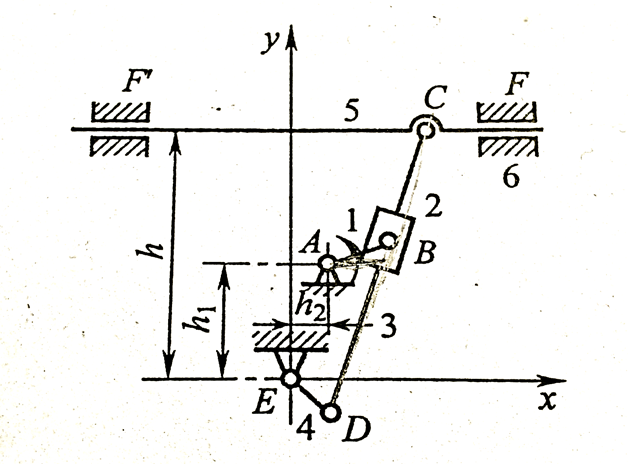 如图所示为一个牛头刨床(III级机构),假设各个构件尺寸如图表所示,原动件1以等角速度ω=1 rad/s沿逆时针方向回转,试求各从动件的角位移,角速度以及角加速度以及刨头C点的位移、速度以及角加速度的变化情况。
首先,我们由AEDB和EDC的两个四边形中,获得几何关系(由于本弱还不知道怎么往网页里面插入Latex,所以只能拿Source Code Pro来凑数了)
l4coso4 + s3coso3 = h2 + l1*coso1
l4sino4 + s3sino3 = h1 + l1*sino1
l4coso4 + l3coso3 – s5 = 0
l4sino4 + l3sino3 = h
直接使用最小二次迭代法求出o3,o4,s5,s3
由于此时求出了o3,o4,s5,s3,对上面这个方程求导即可
2.速度求解:
-l4sino4w4 + s3’coso3 – s3sino3w3 = -l1sino1*w1
l4coso4w4 + s3’sino3 + s3coso3w3 = l1coso1*w1
-l4sino4w4 – l3sino3w3 – s5’ = 0
l4coso4w4 + l3coso3w3 = 0
给出矩阵式:
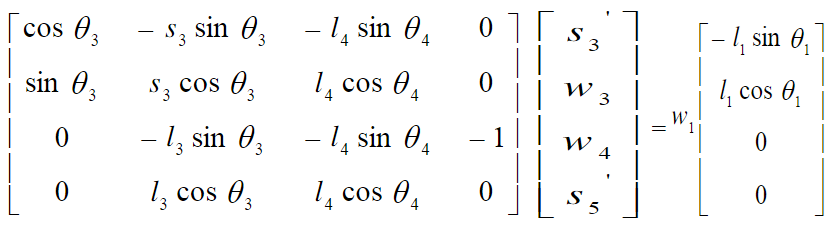
利用高斯消元(解线性方程组)可以得到角速度w3,w4
3.加速度求解
继续对线性方程组进行微分可得:
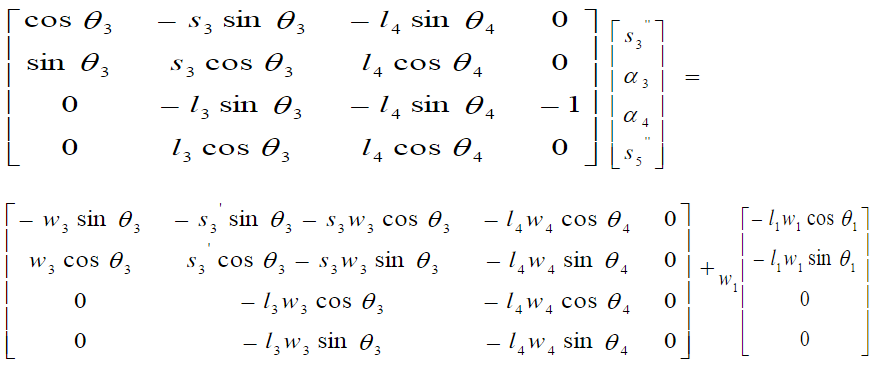
角加速度a3和a4就被解出来了
下面附上第一组的python解法…
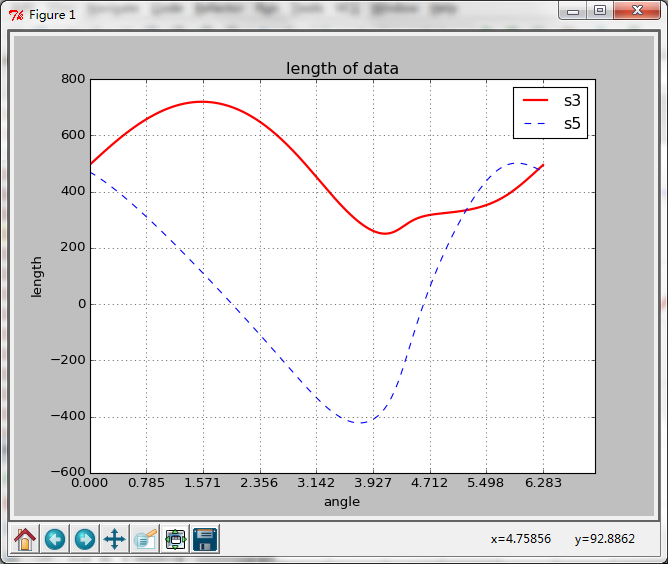
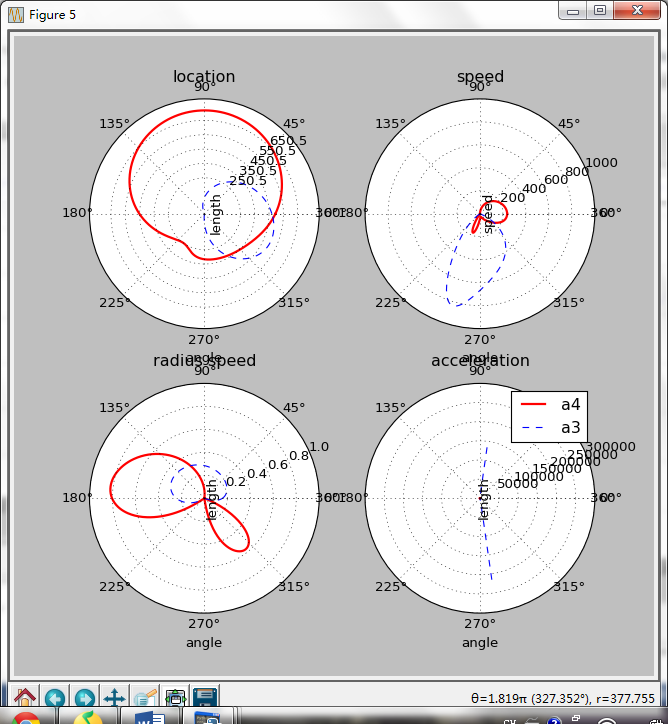
机构的位置:
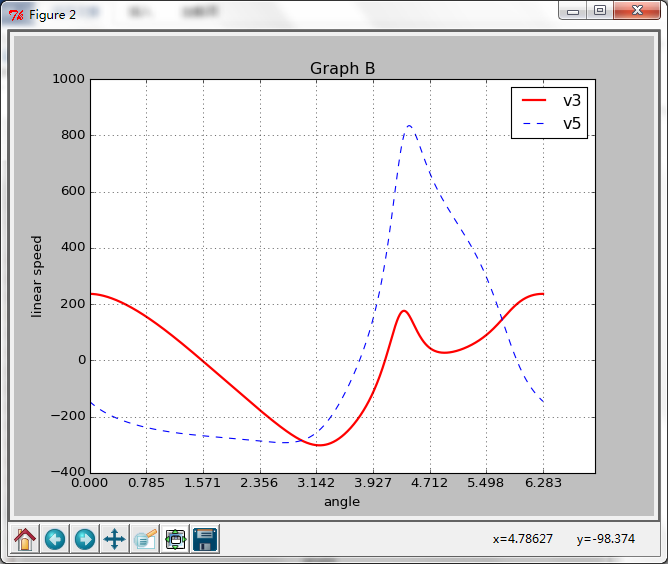
速度的解:
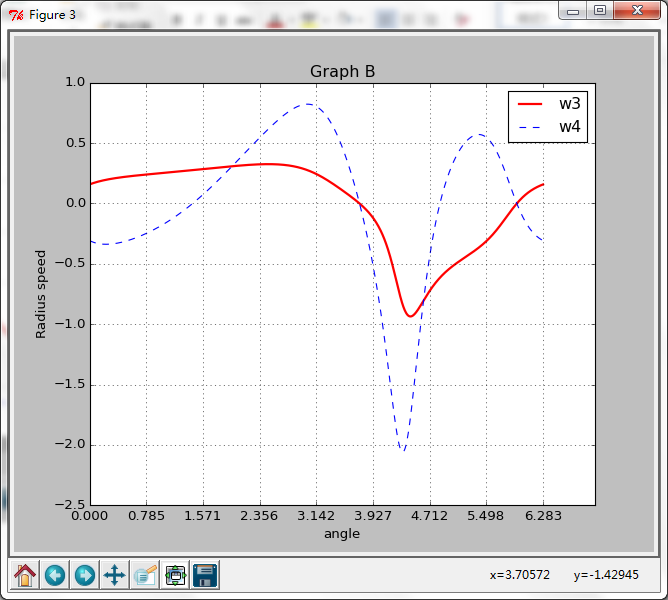
角速度的解
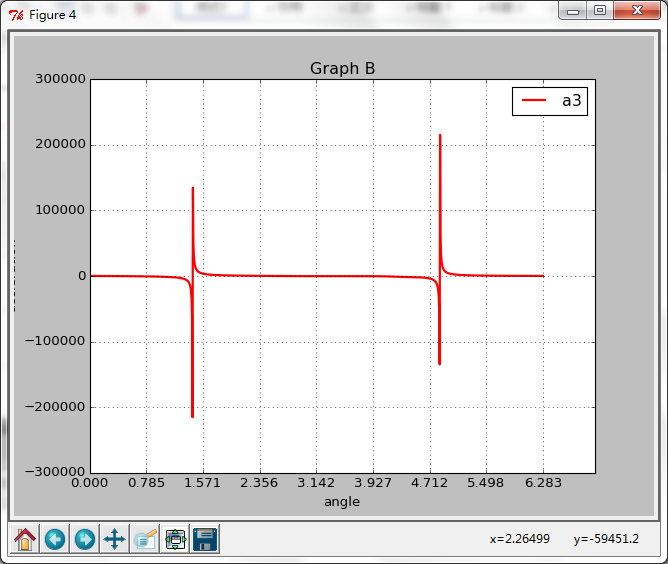
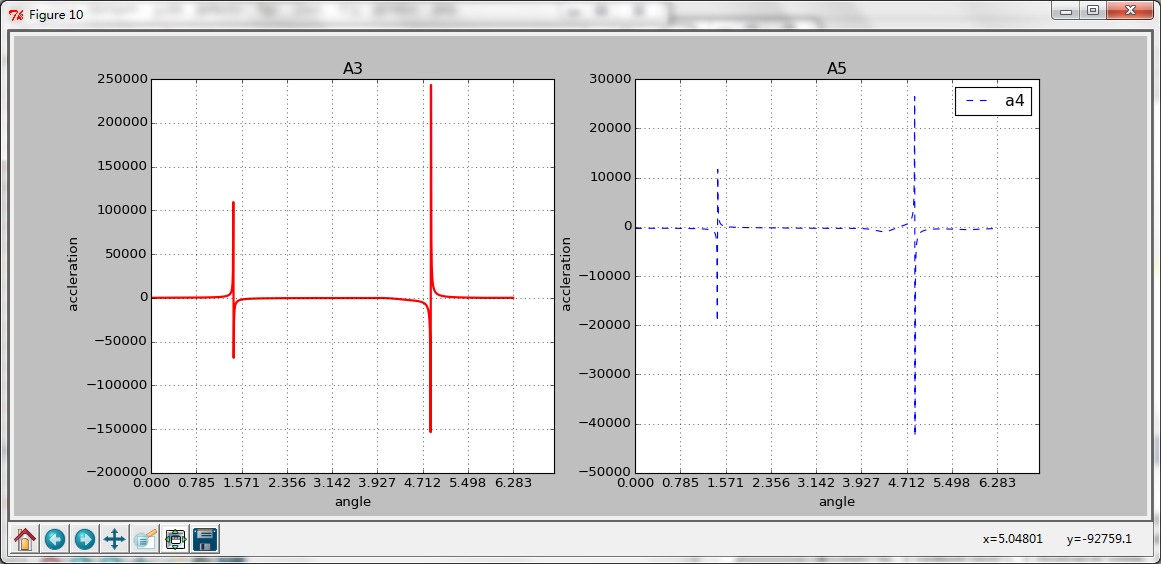
A3的角加速度(好像有个峰值= =、、、)
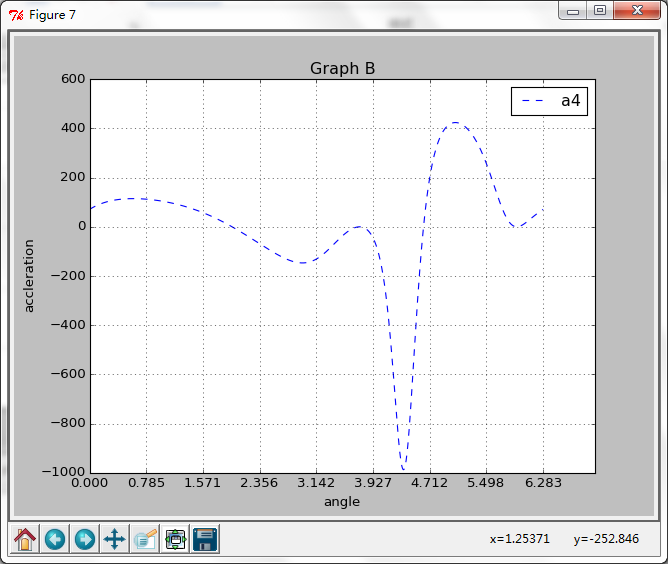
A4的角加速度(小多啦= =、、)
由于这个是周期性的 表示本弱画了一张极坐标图片!
A3和A5的加速度分析
最后附上Python源码(python写的略挫不要介意= =、、、):
|
|